
See the assumptions.
Understand the result.
A planning model should explain itself. Here is how this one works—and where its limits begin.
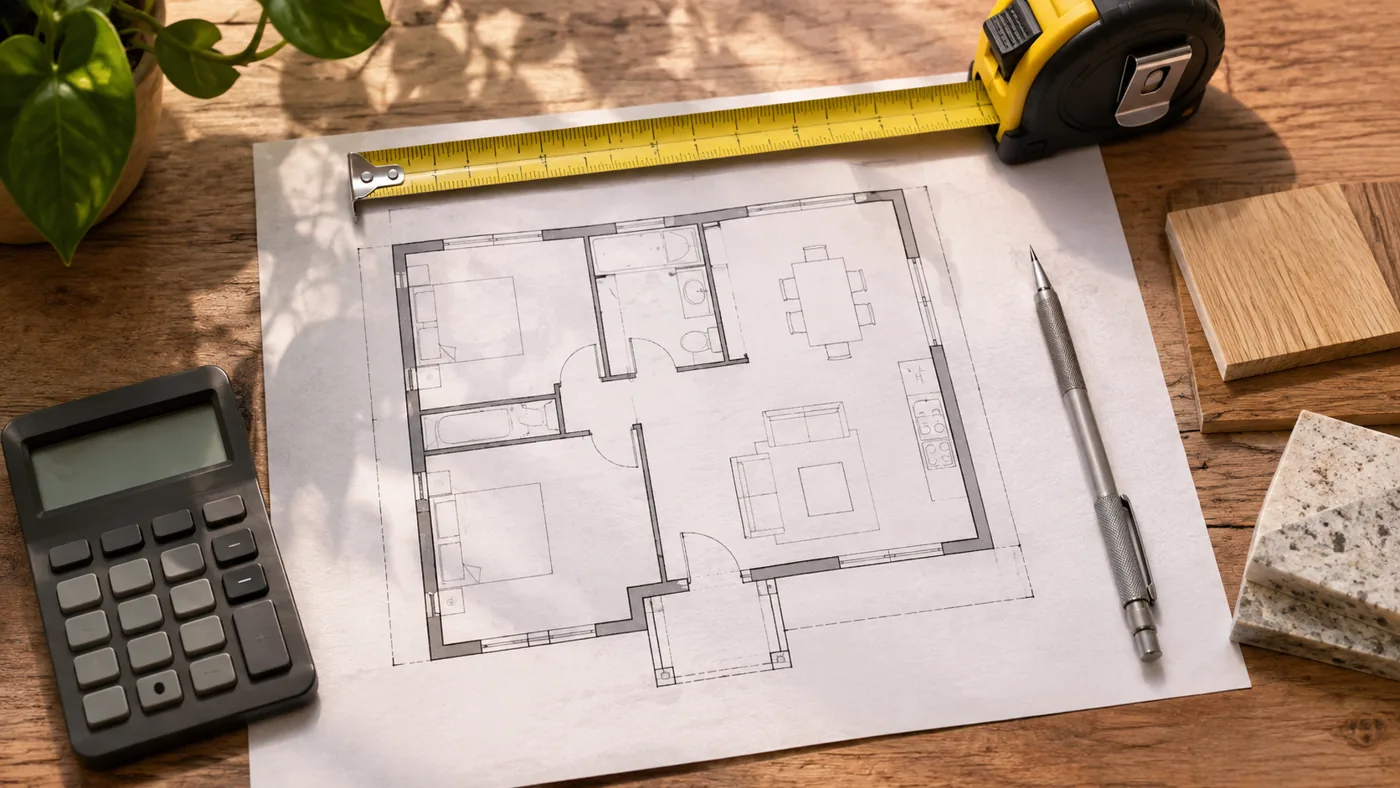
This calculator shows how selected assumptions combine into a residential rebuilding scenario. It is a planning worksheet, not a property inspection, appraisal, contractor bid or insurance valuation.
What the model covers
The model starts with above-grade living area and a selected structure rate. It adds separate allowances for roof upgrades, layout complexity, foundation or basement upgrades, attached garages and porches. A chosen location factor applies to this direct-cost subtotal. Demolition, code, demand-surge, design and permit costs, contractor overhead and profit, and contingency follow in the order below.
The structure base assumes a standard roof. Roof and foundation entries are incremental allowances, not complete trade estimates. Roof upgrades use living square footage as a simplified proxy rather than measured roof area. For a crawlspace or basement, enter the actual affected area; the model does not infer it from the number of stories. A slab selection adds no foundation upgrade. Year built and stories appear in the report but do not automatically change the result.
Land and market value, personal property, temporary accommodation and detached structures are excluded. Site-specific access, contaminated-material removal, unusual foundations and specialist restoration are not assessed automatically. Enter a documented allowance where the model permits it, or obtain a property-specific estimate.
Starting structure rates
US dollars per above-grade living square foot, before the separately listed additions. These are illustrative inherited assumptions, not verified price benchmarks. You can replace the selected base in Advanced assumptions.
| Construction | Economy | Standard | Premium |
|---|---|---|---|
| Wood frame | $150 | $185 | $240 |
| Masonry | $165 | $205 | $265 |
| Concrete / ICF | $175 | $215 | $280 |
| Steel frame | $180 | $225 | $290 |
Starting allowances
Every rate below can be overridden. Choose a value supported by the property's actual scope; a zero means that this model adds nothing for the item.
| Item | Starting assumption | Applied to |
|---|---|---|
| Roof upgrade | Asphalt $0; metal $7; tile $10; slate $18 | Living square feet |
| Layout complexity | Simple 0%; standard 5%; complex 12% | Base structure amount |
| Foundation / basement upgrade | Slab $0; crawlspace $8; unfinished basement $25; finished basement $45 | Entered affected square feet |
| Attached garage | $40 | Garage square feet |
| Porch / deck | $35 | Porch or deck square feet |
| Demolition and debris | $0 | Fixed entered dollars; no location multiplier |
| Code upgrade | 0% | Direct subtotal after location adjustment |
| Demand surge | 0% | Adjusted direct subtotal plus code allowance |
| Design, permits and soft costs | 10% | Adjusted direct subtotal, demolition, code and surge |
| Contractor overhead and profit | 15% | Prior subtotal including soft costs |
| Contingency | 5% | Prior subtotal including overhead and profit |
| Sensitivity scenarios | 20% below and above the calculated total | Total; display only, not an extra cost |
When you use an outside estimate, check what its rates already include. Adding contractor overhead, profit, permits or a roof allowance a second time can overstate the scenario. If all entered unit rates already reflect location, set the location factor to 1.00. A single all-in price may not fit this component model; clear overlapping additions before using it.
State assumptions
These broad inherited factors are not a ZIP-code database, survey of local prices or statement that one state's actual costs have a fixed relationship to another. Use them only as editable scenario assumptions. No location is selected until you choose one.
| State / district | Factor |
|---|---|
| Alabama | 0.92 |
| Alaska | 1.18 |
| Arizona | 1.02 |
| Arkansas | 0.92 |
| California | 1.18 |
| Colorado | 1.08 |
| Connecticut | 1.15 |
| Delaware | 1.06 |
| District of Columbia | 1.23 |
| Florida | 1.05 |
| Georgia | 0.98 |
| Hawaii | 1.30 |
| Idaho | 1.03 |
| Illinois | 1.02 |
| Indiana | 0.95 |
| Iowa | 0.96 |
| Kansas | 0.95 |
| Kentucky | 0.93 |
| Louisiana | 0.94 |
| Maine | 1.02 |
| Maryland | 1.12 |
| Massachusetts | 1.17 |
| Michigan | 0.99 |
| Minnesota | 1.02 |
| Mississippi | 0.90 |
| Missouri | 0.95 |
| Montana | 1.01 |
| Nebraska | 0.96 |
| Nevada | 1.03 |
| New Hampshire | 1.06 |
| New Jersey | 1.15 |
| New Mexico | 0.97 |
| New York | 1.20 |
| North Carolina | 0.98 |
| North Dakota | 0.97 |
| Ohio | 0.96 |
| Oklahoma | 0.94 |
| Oregon | 1.10 |
| Pennsylvania | 1.02 |
| Rhode Island | 1.08 |
| South Carolina | 0.96 |
| South Dakota | 0.95 |
| Tennessee | 0.96 |
| Texas | 1.00 |
| Utah | 1.05 |
| Vermont | 1.05 |
| Virginia | 1.07 |
| Washington | 1.14 |
| West Virginia | 0.92 |
| Wisconsin | 0.98 |
| Wyoming | 0.98 |
Calculation order
- Base structure: living area × selected or overridden base rate.
- Direct subtotal before location: base structure + roof upgrade + complexity allowance + foundation upgrade + garage + porch / deck.
- Adjusted direct subtotal: direct subtotal × location factor. The report shows the difference as a separate positive or negative location adjustment.
- Code allowance: adjusted direct subtotal × code percentage.
- Surge allowance: (adjusted direct subtotal + code allowance) × surge percentage.
- Soft costs: (adjusted direct subtotal + entered demolition dollars + code + surge) × soft-cost percentage.
- Overhead and profit: the preceding subtotal, including soft costs, × overhead-and-profit percentage.
- Contingency: the preceding subtotal, including overhead and profit, × contingency percentage.
- Total: sum of all report lines. Each calculated line is rounded to cents so the displayed detailed amounts reconcile.
The main scenario and its sensitivity bounds are rounded to the nearest $1,000 to avoid suggesting a precise real-world price. The detailed report retains cents only to expose the arithmetic. The percentage allowances compound; 10% soft costs, 15% overhead and profit, and 5% contingency do not equal a simple 30% addition.
What the range means
The default range is the calculated total multiplied by 0.80 and 1.20. Change the sensitivity percentage from 0% to 50% to explore a different scenario. These endpoints do not represent a statistical confidence interval, an empirically measured error band, a market quote or a promise that the actual cost will fall between them. A wider range does not cure missing or incorrect assumptions.
Comparison with insurance
An optional dwelling limit can be compared arithmetically with the model total. That difference is not a finding of underinsurance or excess insurance. Policy definitions, endorsements, coverage for demolition or code work, and the scope of the insurer's valuation may differ. Discuss changes to coverage with a qualified insurance professional rather than choosing a limit solely from this worksheet.
Reports and older links
Calculate and review results on screen without providing contact information. To use the built-in print/save-PDF, data-download or share controls, submit your name, property address, phone number and email once for the current page session. Export is enabled after our contact service confirms receipt. The worksheet is not sent with this request. The data download contains the entered inputs, resolved rates, detailed results, assumptions, exclusions, preparation timestamp and model version. A copied scenario link includes property characteristics and assumptions but omits the optional dwelling limit. Calculating a result does not submit a contact request. Contact details entered to unlock exports are not included in the report or shared scenario link. Export does not validate the prices or establish coverage.
Older shared links restore supported inputs after validation. ZIP-based adjustments are retired, the automatic age-based code uplift is removed, and an actual foundation area is required for non-slab upgrades. The earlier catastrophe checkbox becomes an editable 10% surge scenario when selected. These changes can produce a different result from an older saved link; the calculator displays a review notice.
Input limits and review
The interface requires a state and 100–100,000 living square feet. It rejects negative quantities, non-finite values, unknown construction options and invalid URL inputs. This broad technical range is not a claim that the model is validated for every building size. Complex, historic, custom and very large homes should receive an individual reconstruction assessment. Commercial properties need an occupancy-specific method; see the commercial reconstruction section.
The model is deterministic: the same validated inputs and model version produce the same result. It does not call an AI model, valuation API or live construction-cost feed. No third-party source is being represented as the origin or endorsement of the inherited prices.